Mailchimp Audience Analytics
Small businesses open Mailchimp with one question: is my audience growing? I built the reporting that answers it, across email, SMS and WhatsApp.
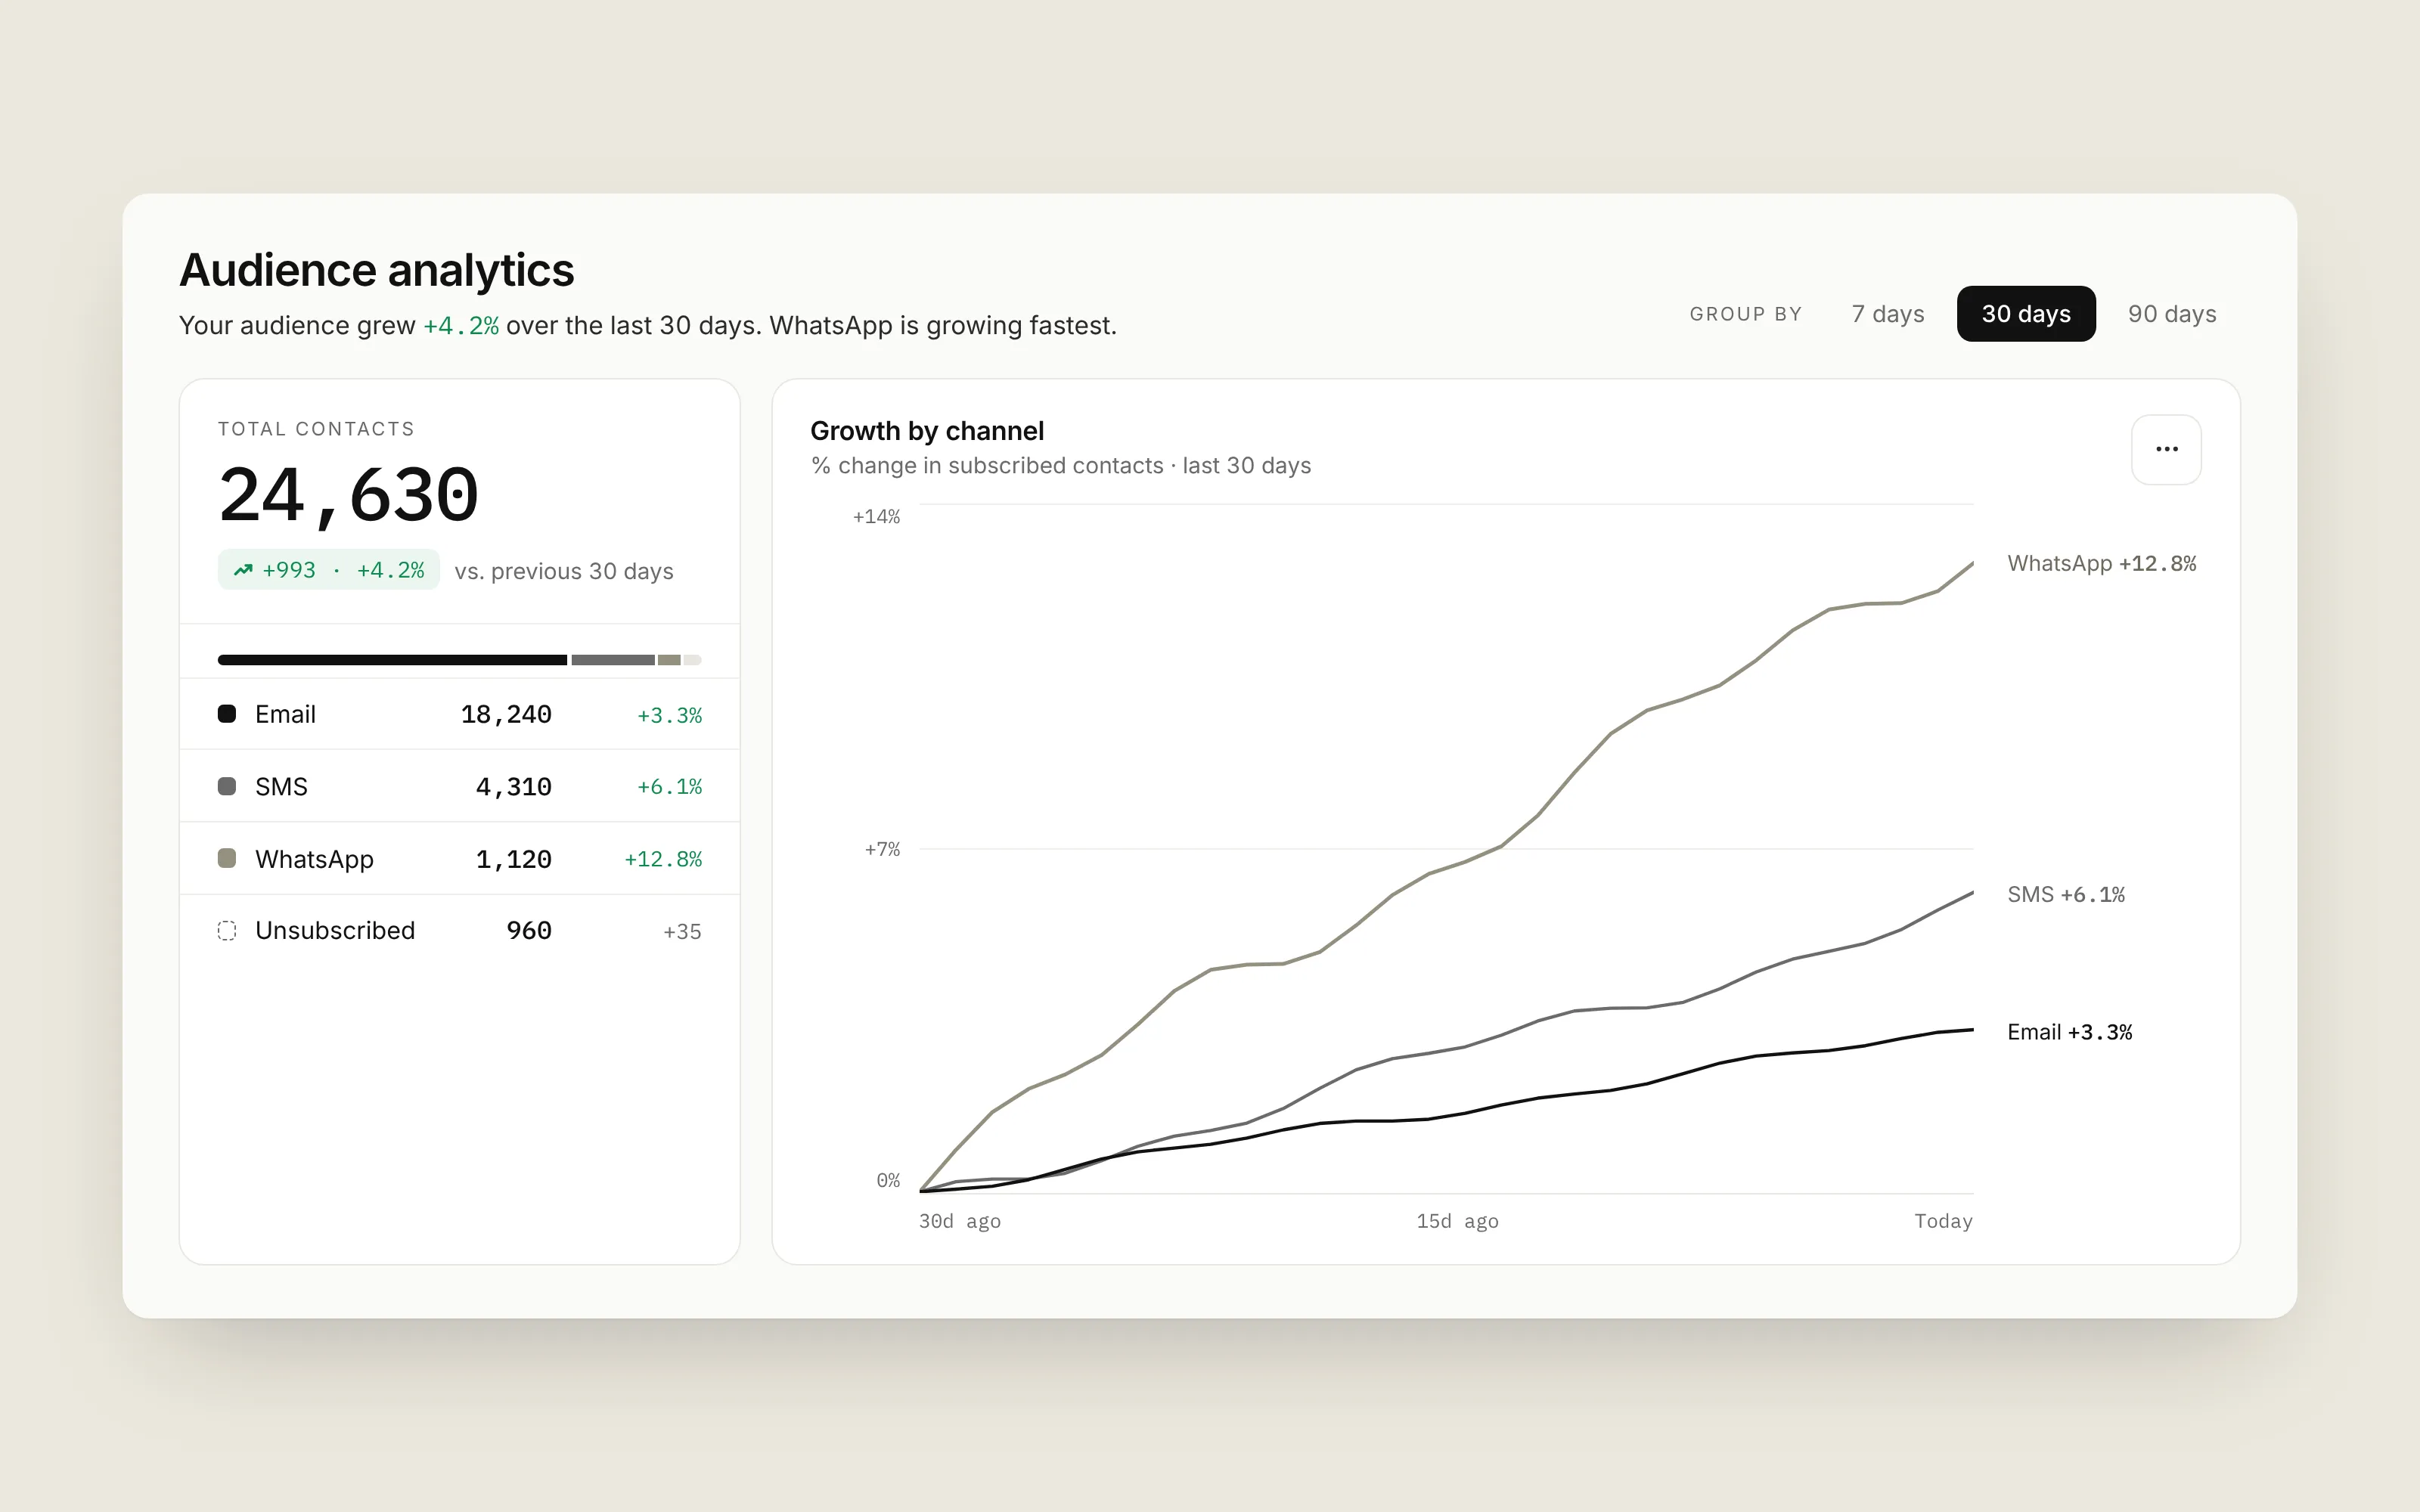
The screens here are a recreation with sample data. No internal screenshots, numbers or code from Mailchimp are shown.
The question behind the page
Most people who open an analytics page aren’t looking for analytics. They have one question: “Is my audience growing, and where is it coming from?” The page had to answer that at a glance for someone running a bakery, and still hold up for a marketer digging into last quarter by channel.
Two details carry most of the weight. One time control (7, 30 or 90 days) drives every number and chart on the page. And unsubscribed contacts are shown next to each channel instead of quietly dropped, so the rows always add up to the headline total and nobody wonders why the math doesn’t match.
What I worked on
Leading WhatsApp reporting. I led a team of three frontend engineers and partnered with product, design and backend to move five WhatsApp reporting surfaces to GraphQL. Each chart now asks for exactly the metrics it shows, which made the pages faster to build on and easier to reason about.
SMS results in minutes, not hours. I rebuilt SMS recipient reporting to stream delivery and engagement metrics as they arrive. People used to wait hours to see how a send performed; now they can catch a problem while there’s still time to fix it.
A widget on the homepage. With a partner team, I built the Marketing Snapshot widget on Intuit’s App Fabric micro-frontend platform, surfacing engagement and attributed revenue on Mailchimp’s homepage.
Audience Analytics, built to be trusted. I moved three Audience Analytics components to GraphQL and built their Playwright end-to-end suite. In reporting, a wrong number looks exactly like a right one, so tests are what keep the page honest.
Shared chart components. I migrated the email click-performance view to TypeScript and built reusable chart components, so new reports share one look and behavior instead of each reinventing it.
What I took away
The hardest part of analytics UI isn’t the chart. It’s trust. People act on these numbers, so every total has to reconcile, every comparison has to say what it’s comparing against, and the page has to be honest about what it doesn’t know yet. That idea carried straight into how I approach my own work, including Caldera.